
Reports
Your weekly numbers: paid sales, net revenue, refunds, time to claim and prescription, new patients and staff activity, how each metric is counted, exports, and where recurring revenue lives.
Reports shows your sales, how fast orders move, patient growth and staff activity for the dates you pick. Left menu → Reports. Client Admin only.
What you can do here
- Pull your weekly numbers
- See the records behind a number
- Export to a spreadsheet
- Look at one product
Pull your weekly numbers
Use this every Monday for your leadership update. It takes about five minutes.
Pick the week
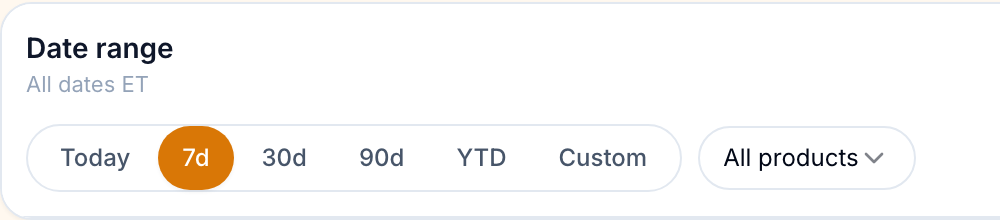
Under Date range, click 7d, or Custom for exact dates. Every card compares with the period before, of the same length.
Sales
Note Paid sales, Net revenue, Paid orders and Refund rate.
Speed
Under Fulfillment & turnaround, note Avg time to claim and Avg claim to prescription: how fast your provider network picks up and finishes reviews.
Patients
Under Patients & team, note New patients and Active patients (last 30 days).
Stuck orders
Orders in flight counts today's unfinished orders by stage: Awaiting payment, Awaiting forms, In review, At pharmacy, Shipped.
Recurring revenue
Open Subscriptions in the left menu: Recurring revenue (monthly), Renewing in 7 days and Needs attention (failed or unpaid renewals).
You'll know it worked when each card shows a value and its change against the week before.
Who can do this: Client Admin. Client Staff have no Reports, and see Subscriptions only with the Manage subscriptions permission.
See the records behind a number
Use this when a number looks wrong or you need the names behind it.
Open the records
Click View records on a card, such as Paid sales or New patients.
Read or export
The sheet lists the records behind the number. Export CSV downloads them; Close sheet goes back.
You'll know it worked when a sheet opens titled with the metric and Records behind the selected metric.
Who can do this: Client Admin.
Export to a spreadsheet
Use this for your accountant or your own spreadsheets.
All orders
Click Export orders (CSV), top right. It uses the date range and product you picked.
One table
Sales by product and Staff activity each have their own Export CSV.
You'll know it worked when the toast reads Exported N rows. and the file downloads.
Who can do this: Client Admin.
Look at one product
Use this to see how one product sells.
Pick the product
Open All products, next to the dates, and choose it. New patients over time and Staff activity ignore this filter.
You'll know it worked when Sales by product shows only that product.
Who can do this: Client Admin.
What's on this page
Hover What is this? on a card for its definition. In short:
| Metric | How it's counted |
|---|---|
| Paid sales | Value of orders with a payment date in the range, before refunds. |
| Net revenue | Paid sales minus refunds on those same orders. |
| Average order value / Paid orders | Average and count of paid orders. |
| Refund rate | Refunds on orders paid in the range, divided by their paid sales. |
| Payment failures | Failed payments on orders. Pharmacy failures and failures before an order exists aren't counted. |
| Sales by product / Coupon usage | Paid orders, revenue, refunds and first and last sale per product; redemptions per promo code. |
| Avg time to delivery | Paid order to delivered. |
| Avg time to claim | Review submitted to a provider claiming it. |
| Avg claim to decision / Avg claim to prescription | Claim to approve or deny; claim to the first prescription sent (reviews without one are left out). |
| Refills | Refill orders paid in the range. |
| Active prescriptions, Total patients, Orders in flight | As of today; they ignore the date range. |
| New patients | Patient records created in the range, including imports. |
| Active patients (last 30 days) / Staff activity | Patients who used the portal, and staff sessions, in the 30 days ending on the range's last day. |
What can go wrong
| What you see | Why | Fix |
|---|---|---|
| Everything shows $0 | No payments in the range; the page opens on the last 30 days. | Click 90d or YTD. |
| A speed card reads Not available | Nothing qualified in the range. | Pick a longer range. |
| Paid sales doesn't match your processor | It counts by payment date, before refunds and processor fees. | Compare Net revenue, and check Billing → Transaction History. |
| You can't find what GEN Health or the pharmacy charges you | Reports shows what patients pay you. | GEN Health charges: Settings → Account and billing. Pharmacy charges: raise an OnlyScripts ticket. |
| Export timed out. Please try again. | The range is too big. | Export a shorter range. |
Questions people ask
Where is MRR, or recurring revenue?
On Subscriptions: Recurring revenue is every active plan normalized to a month.
Can I see conversion, churn or where patients came from?
Not on Reports. Promo codes show in Coupon usage; UTM tags go to your webhooks (see Put checkout on your own website).
Why is Avg time to claim so long?
It counts every hour from submission to claim, nights and weekends included. It measures your provider network: message them if it's slow.
How do I get a list of visits, async and sync?
Visits → History → Export CSV. The Type column says ASYNC or SYNC.
Can Client Staff see Reports?
No. Share an export with them instead.
Related
Was this helpful?