
Reports
Network reports: demand and turnaround per client, provider productivity, what each number counts, month-end exports for invoicing and provider pay, and unbilled visits.

Reports turns your network's activity into numbers you can check and export: visits, queue demand and turnaround, provider workload, and client revenue and costs. Left menu → Reports, or Open reports on the Dashboard. Provider Network Admin; Providers and Provider Delegates see only their own numbers.
What you can do here
- Check demand and turnaround, per client
- Check provider productivity
- See what a number counts, and the records behind it
- Export visits for client invoicing and provider pay
- Find visits you didn't bill
Check demand and turnaround, per client
Use this every morning, or when a client asks how fast their patients are seen.
Pick the client
Choose one in All clients at the top, or leave it for the whole network. All client models narrows to Review Only, Review + Prescribe or Affiliate.
Read the queue
Under Demand & turnaround, Pending async reviews, Oldest pending review and Upcoming visits are right now, whatever the date range.
Read turnaround
Pick a range (Today, 7d, 30d, 90d, YTD or Custom), then read Median review turnaround, Avg time to claim and Avg claim to prescription.
You'll know it worked when the turnaround tiles change with the range and the three queue tiles don't.
Who can do this: Provider Network Admin. To compare clients side by side, clear the client and use Visits by client or Visits by protocol → Choose protocols.

Check provider productivity
Use this for workload reviews, scheduling and provider pay.
Pick the range
For example 30d.
Read the Providers section
Active providers counts providers who finished at least one visit in the range; Prescriptions sent counts scripts.
Open Provider workload
Each row shows Completed, Async, Sync, Avg turnaround, Rx sent, Cancellation rate and Last active. Click a row to open that provider's profile; Export CSV downloads the table.
You'll know it worked when every provider with visits in the range has a row.
Who can do this: Provider Network Admin. Providers see the same numbers for themselves under My performance.
See what a number counts, and the records behind it
Use this before you quote a number to a client.
Read the definition
Hover the info icon (What is this?) beside a tile.
Open the records
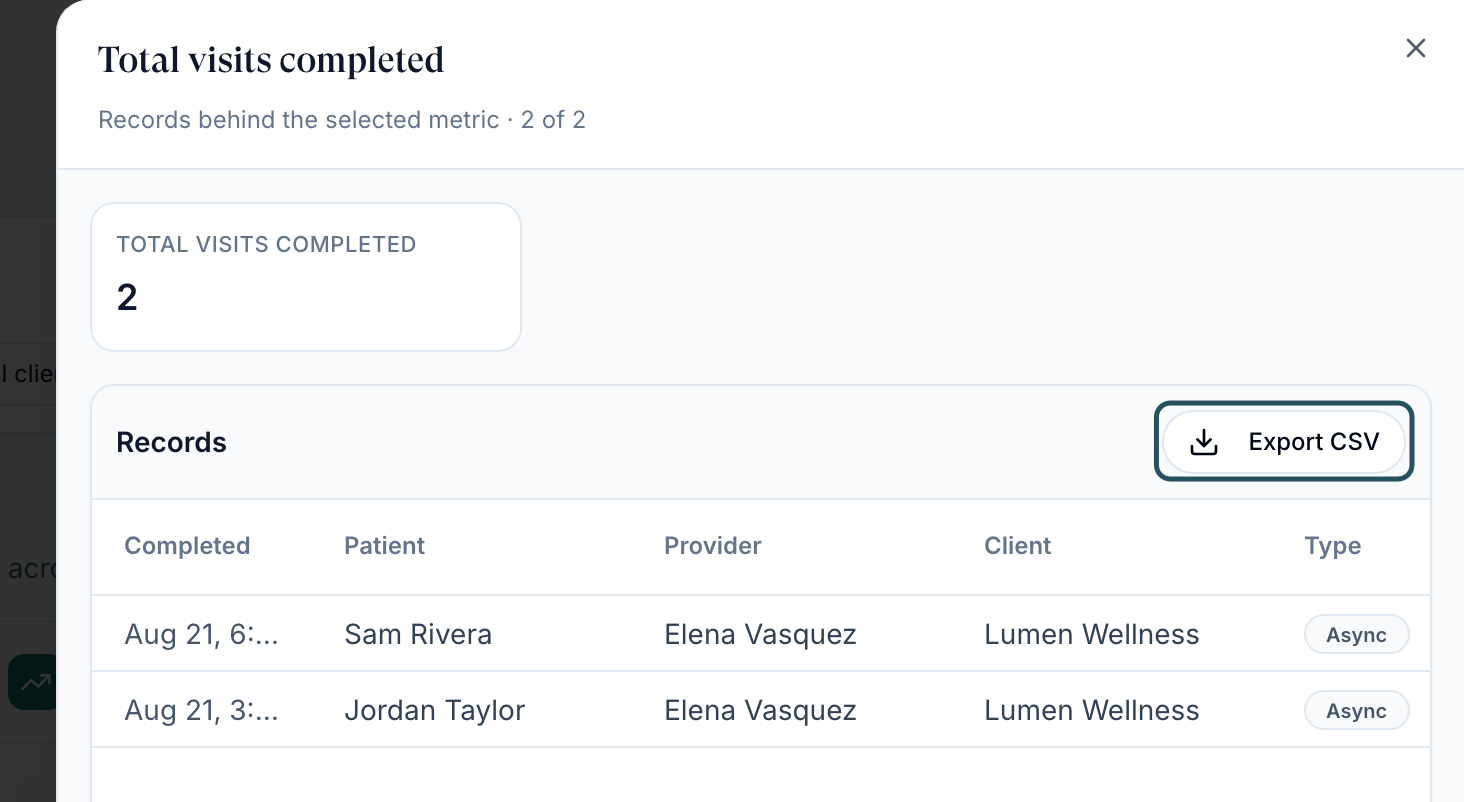
Click the tile. A sheet lists the Records behind the selected metric; its Export CSV downloads them.
You'll know it worked when the sheet's count matches the tile. The address bar keeps the range, client and open sheet, so you can share the link.
Who can do this: Provider Network Admin.
Export visits for client invoicing and provider pay
Use this at month end.
Set the range
Click Custom and pick the month. Choose a client if you're invoicing one.
Export every visit
In All visits & money trail, click Export CSV. Each visit (completed, cancelled or no-show) comes with Client model, Type, Status, Product / form, Patient paid, Visit charge, Pharmacy cost and Rx review fee.
Or export the history
Export visit history (CSV) at the top downloads the visit set for your range and filters.
You'll know it worked when the toast reads Exported N rows. and the file downloads.
Who can do this: Provider Network Admin. Don't add up Patient paid: one order behind two visits shows on both rows. A blank Visit charge means no rate is set for that client.
Find visits you didn't bill
Use this when Unbilled visits is above 0.
See which
Under Client activity & COGS, click Unbilled visits to list visits with a decision and no visit charge.
Set the fee
Set that client's visit fees so new visits are charged.
You'll know it worked when new visits for that client show a Visit charge.
Who can do this: Provider Network Admin; each network sets its own fees.
What's on this page
| Tile | What it counts |
|---|---|
| Total visits completed | Visits with an approved, deferred or denied decision in the range, split into Async and Sync |
| Scheduled visits | Visits scheduled to happen in the range |
| No-show rate, Cancellation rate | Share of booked visits where the patient didn't show, or that were cancelled |
| Pending async reviews | Async visits waiting on a provider decision right now |
| Oldest pending review | How long the longest-waiting review has sat in the queue |
| Upcoming visits | Live visits booked for the next 7 days |
| Median review turnaround | Assignment to decision, for reviews completed in the range |
| Avg time to claim | Submission to a provider claiming it |
| Avg claim to prescription | Claim to the first prescription sent; reviews without one are left out |
| Net | Sales revenue minus Total COGS; activity, not a payout balance |
| Sales revenue | Product, lab and invoice sales by payment date, net of refunds |
| Visit cost | Async, live and escalation charges billed to the client |
| Prescription cost | Prescription review charges; $0 until a prescription fee is set |
| Lab cost | Lab vendor cost plus platform fee, settled fees only |
| Unbilled visits | Visits with a decision and no matching visit charge |
What can go wrong
| What you see | Why | Fix |
|---|---|---|
| Three tiles ignore the date range | The queue tiles are As of now. or Next 7 days. | Read the turnaround tiles for the range. |
| Your export has no product or cancelled visits | The Visits table lists completed visits only | Export All visits & money trail instead. |
| Active providers is below your headcount | It counts providers who finished a visit in the range | Use Providers for headcount. |
| You need demand per pharmacy or product over months | There's no such report | Ask GEN Health in Support for a custom export. |
| Couldn't refresh — showing recent data. | The numbers are stale | Click the refresh icon before quoting anything. |
| Export timed out. Please try again. | The range is too large | Narrow the range or pick one client. |
Questions people ask
Whose timezone are the dates in?
Eastern Time. The line above the ranges reads All dates ET, with how recently the data updated.
Can I get every patient, encounter, order and charge for one client?
Pick the client, then export All visits & money trail and Client activity.
Net is negative. Do we owe that?
Only for affiliate clients, where your network collects payment and pays the pharmacy. For other clients it reads as margin.
Why do my providers see a different page?
Providers and Provider Delegates get My performance, limited to their own work, with no client filter.
Related
Was this helpful?